
Project Overview
My Role: Lead UX Researcher
Duration: 6 Months
Users: Command Center Software Customers with Recent Deployments (5 years), MSI Deployment Resources
Team: UXR Interns, Data Scientist, Senior UXR (Christina), UXR Manager, UXD Manager, Chief of Staff of Devices & Customer Experience, and VP of Command Center Software
Request Origin: Office of the CTO
Problem Statement

The software products lack a comprehensive understanding of the end-to-end customer experience journey, leading to potential misalignment between product features and user needs. This gap in knowledge may result in:
Unaddressed user pain points
Missed opportunities for product improvement
Decreased user satisfaction and retention
Inefficient resource allocation in product development
Goals & Objectives

To address these issues and enhance product offerings, the team conducted foundational user research to map the entire customer experience journey, identified key touchpoints, and uncovered deep insights into user needs, expectations, and challenges.
Goals
Develop a comprehensive understanding of the end-to-end customer experience journey for the software products.
Align product features with user needs and expectations.
Improve overall user satisfaction and retention rates.
Optimize resource allocation in product development.
Objectives
Map the customer experience journey:
Identify all touchpoints between users and the software products.
Document the user's actions, thoughts, and emotions at each stage of the journey.
Analyze and synthesize research findings:
Identify common patterns and themes in user behavior and feedback using Grounded Theory.
Prioritize user pain points based on frequency and severity.
Create user personas and journey maps to visualize the findings.
Develop actionable insights:
Generate a list of at 20+ specific recommendations for product improvements.
Identify 3-5 key areas where the product can better meet user needs.
Share findings and recommendations:
Present research results to key stakeholders within 2 weeks of completion.
Develop a detailed report outlining the research methodology, findings, and recommendations.
Share research insights through reports and actionable insights tracking documentation for Project Management.
Project Timeline Example

Research Methods
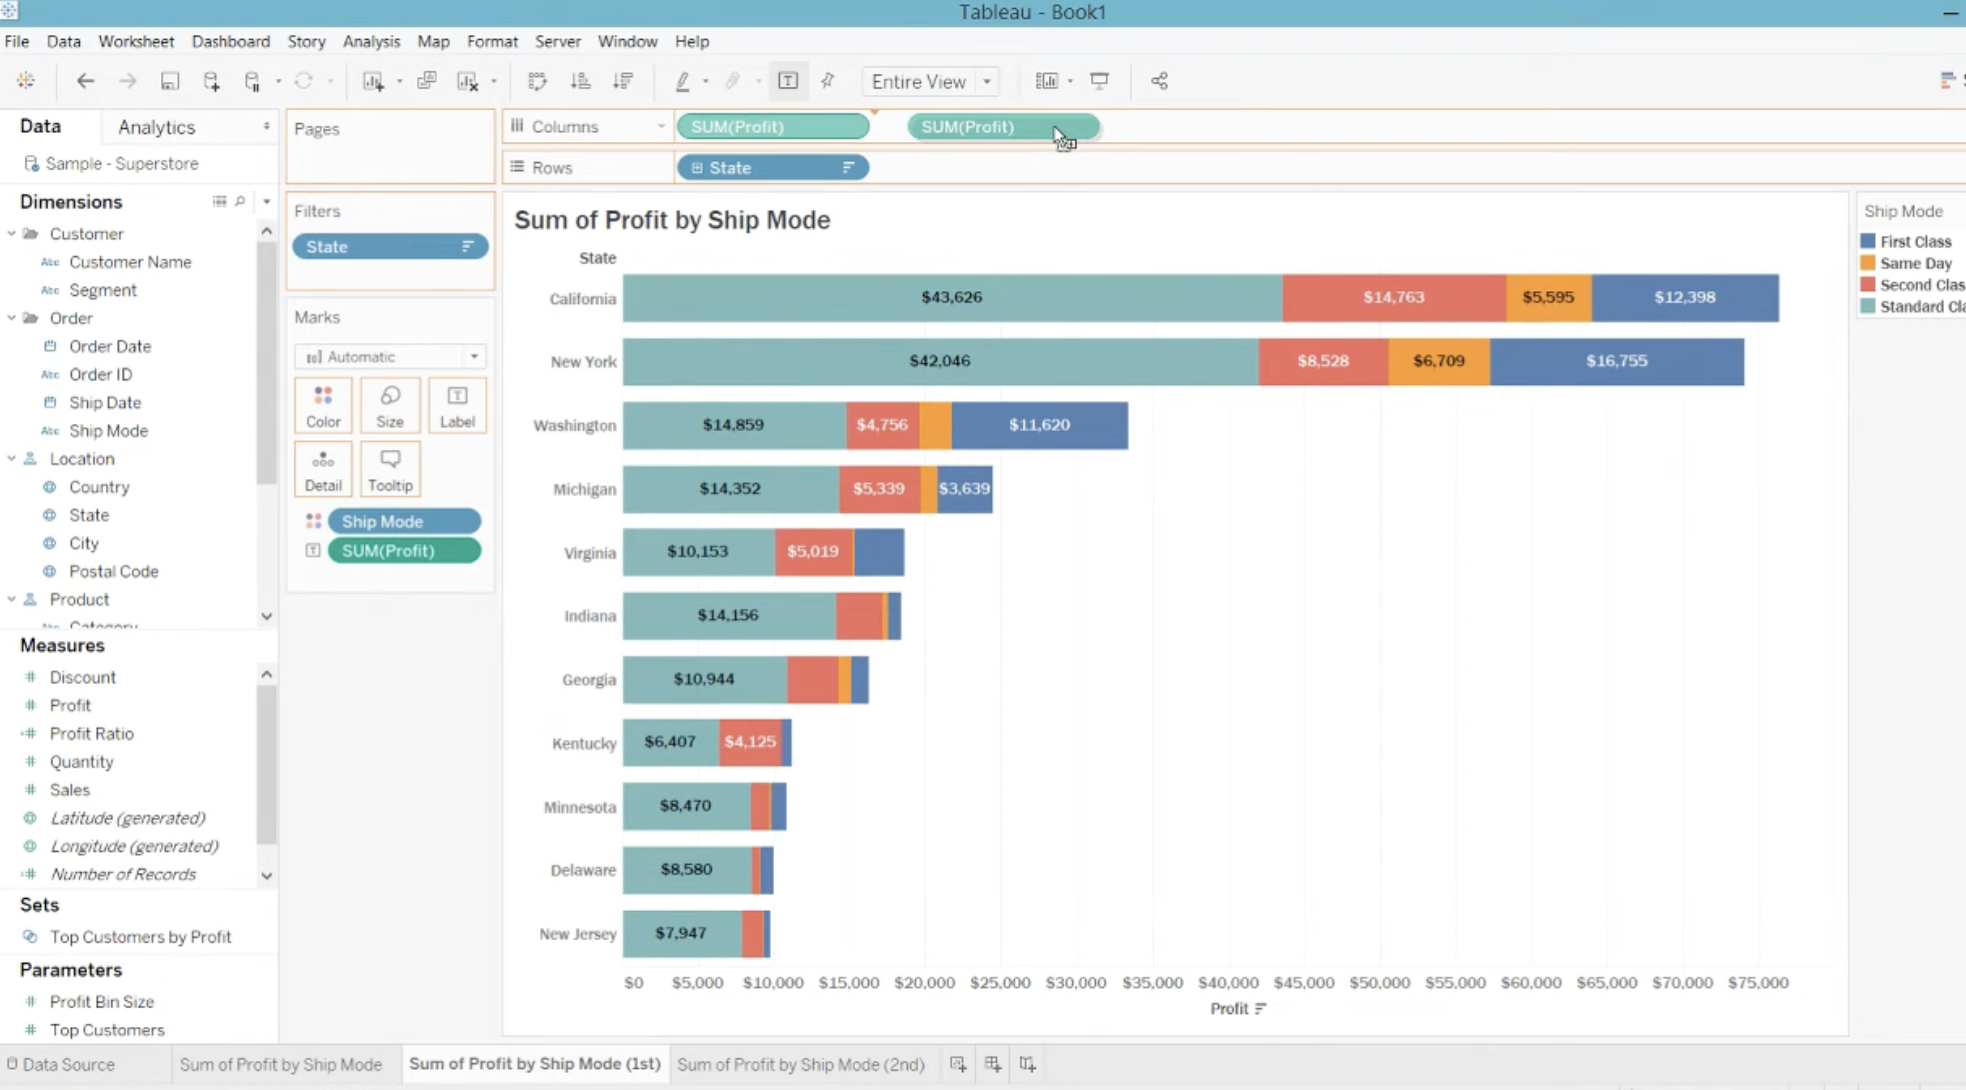
Quantitative Analysis

Explanation: Investigated sales and supply chain data to uncover process insights and potential pain points.
Rationale: Provided quantitative insights into the duration of the deployment process, identified which steps took the longest, and determined when contracts started lagging.
In-depth Interviews

Explanation: Conducted one-on-one discussions to explore individual experiences and motivations in detail.
Rationale: Gained deep insights into user behaviors and uncovered complex issues.
Focus Groups

Explanation: Facilitated group discussions to gather diverse perspectives and observe social interactions.
Rationale: Generated ideas and analyzed how group dynamics influenced decision-making.
User Surveys

Explanation: Developed and distributed structured questionnaires to collect data from many participants.
Rationale: Quickly gathered broad, quantifiable insights to validate findings and identify trends.
The Process
Planning
The team developed a comprehensive research plan, outlining the objectives, methodologies, and timeline. They identified key user segments and determined appropriate sample sizes for each research method. The team also created interview guides, survey questions, and focus group protocols to ensure consistency across all data collection efforts.
Recruitment
Researchers leveraged existing user databases and employed screening surveys to identify suitable participants. They sought a diverse representation of users across different software experiences and year of most recent deployment. The team also arranged and managed the scheduling of interviews and focus groups.
Research Execution

The research team conducted in-depth interviews with users, exploring their experiences, needs, and pain points throughout the software product journey.
They facilitated focus groups to encourage discussions and uncover shared experiences among users.
Additionally, the team distributed online surveys to gather quantitative data on user satisfaction, preferences, and sales process and deployment metrics.
Data Analysis
The research team took a rigorous and multi-faceted approach to analyzing the collected data.
Researchers transcribed and coded qualitative data from interviews and focus groups, identifying recurring themes and patterns. They performed analysis on survey responses to quantify user sentiments and behaviors. The team then synthesized findings from all research methods to create a holistic view of the customer experience journey.
Affinity Mapping
Researchers conducted collaborative affinity mapping sessions to organize qualitative data into themes. They used large whiteboards and sticky notes to visually group similar user comments, behaviors, and pain points. This process allowed the team to identify overarching themes and patterns across the user experience journey.
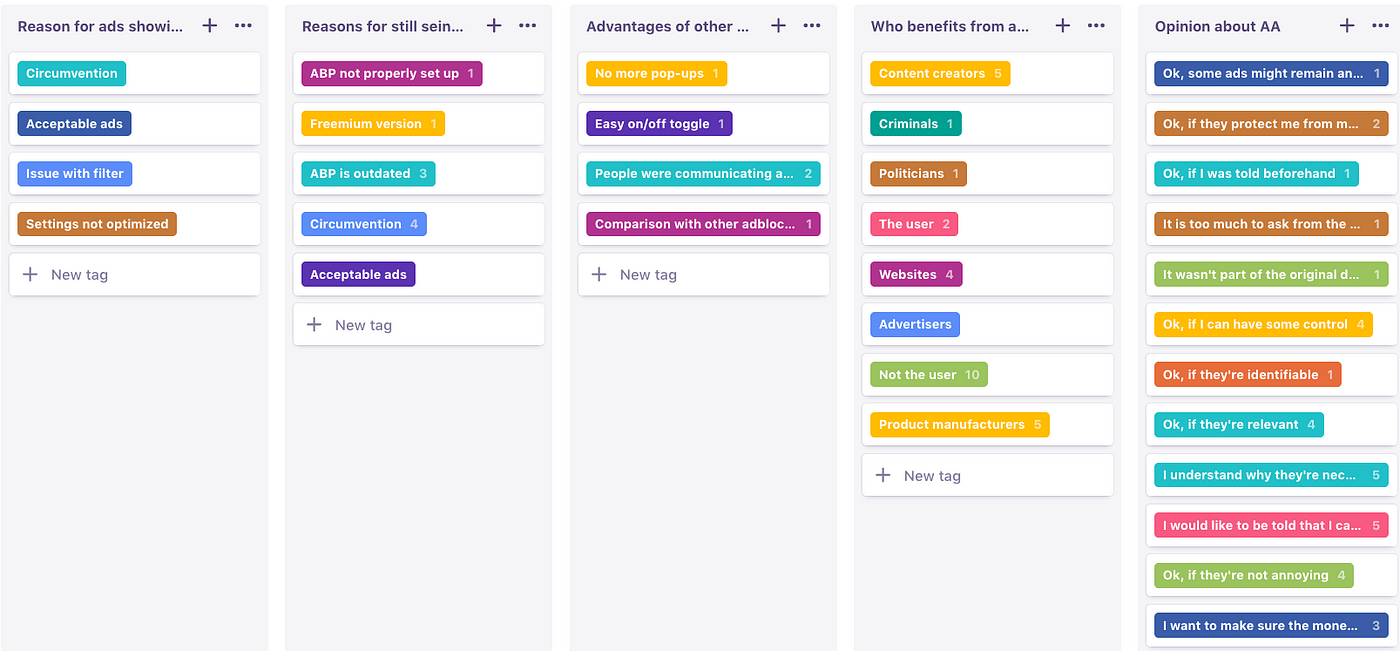
Qualitative Data Coding
The team also utilized a thematic analysis approach for coding the qualitative data. They began with open coding, assigning initial codes to raw data, then progressed to axial coding to identify relationships between codes. Finally, they performed selective coding to develop core themes. The team used Dovetail, a qualitative research software, to manage and analyze the coded data efficiently
Findings & Insights
Example Quotes & Key Findings
"I love the software's features, but navigating between them feels like a maze." - User 27, Interview
"The onboarding process was overwhelming. I felt lost and didn't know where to start." - Focus Group Participant 3
Insights
The research team distilled the analyzed data into actionable insights. They developed comprehensive journey maps illustrating the end-to-end customer experience. The team identified critical pain points in the user journey and prioritized them based on frequency and severity. They also uncovered unmet user needs and expectations, providing opportunities for product enhancement.
The researchers generated a list of specific recommendations for product improvements, backed by data-driven insights. They highlighted areas where the software products excelled and where they fell short of user expectations. The team also identified emerging trends in user behavior and preferences that could inform future product development strategies.
Throughout this process, the team maintained open communication with stakeholders, providing regular updates and preliminary insights. They also ensured adherence to ethical research practices and data protection regulations.
Business Impact
Operational Excellence
The team provided specific recommendations for product improvements, backed by data-driven insights, enabling the company to optimize its operations and allocate resources more efficiently. This approach led to streamlined processes and cost savings. They maintained a focus on actionable outcomes throughout the analysis, ensuring that their findings could be directly applied to enhance the product's performance and user experience.
Improve Customer Satisfaction and Retention
By identifying critical pain points and prioritizing them based on frequency and severity, the company can address the most pressing issues in the user journey. This targeted approach to problem-solving is likely to result in higher customer satisfaction, potentially leading to improvements in customer retention rates.
Data-Driven Decision Making
The comprehensive journey maps and data-driven insights provide a solid foundation for strategic decision-making. This can result in more effective resource allocation and higher return on investment for product development and marketing initiatives.
Learning & Reflection
Looking back, I learned substantially. A few things I look back, reflect, and would change include:
Selectively limit the deployment journey content: This includes establishing the metric of “Duration” from the start and considering visual communication concepts in the final report.
Consider alternate activities for focus group sessions. The methods selected could have been easier to explain and complete. This would have eliminated the need change the activity in real time when noticing it was too complex.
Incorporate quantatiative data team sooner. Tying together the qualitative and quantitative details was no easy task. While it was a cross-functional bonding moment, the extended hours could have been avoided.